This website is directed exclusively at Professional Clients and Eligible Counterparties as defined in the FCA Handbook. It is not intended for Retail Clients.
By continuing, you confirm that:
You are a Professional Client or Eligible Counterparty and are not a Retail Client.
You understand that the information on this website is provided for information only and does not constitute investment, legal, tax or other professional advice.
You understand that capital is at risk, the value of investments may fall as well as rise, and past performance is not a reliable indicator of future results.
Nothing on this website constitutes an offer or solicitation to buy or sell any investment or financial instrument. Information is provided for informational purposes only and may not be relied upon in any jurisdiction where such communications would be unlawful.
Welcome to Kuvera Capital
22 years of investment experience in Indian Equities
Kuvera Capital Partners LLP (KCP) is an alternative asset manager specialising in Indian Equities. KCP manages the Kuvera Fund (ISIN:MU0671S00000),
one of the first Indian dedicated long/short funds to be launched. It was co-founded in 2004 by Raju Kamath with seeding from Marshall
Wace. Kuvera seeks to provide clients with disciplined exposure to Indian equity markets through active risk management.
As with all investments, capital is at risk and the value of investments can go down as well as up. Past performance is not a reliable indicator of future results.
⚠ Past performance is not a reliable indicator of future results. The value of investments and the income from them can fall as well as rise and investors may not get back the amount originally invested. All figures shown are net of fees unless stated otherwise.
Click on a bar to see the value.
Source: Kuvera Capital Partners LLP. Performance shown net of fees unless stated otherwise. Full methodology available on request.
ANNUALISED RETURN
STANDARD DEVIATION
KFL
10.30%
12.37%
Nifty ($)
9.68%
25.55%
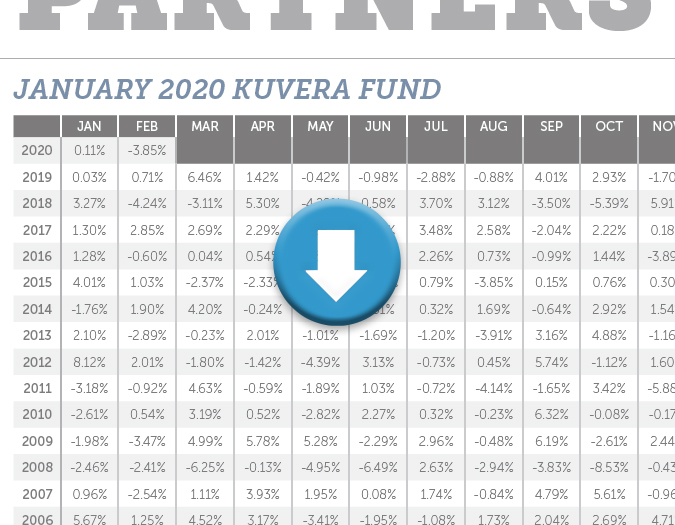
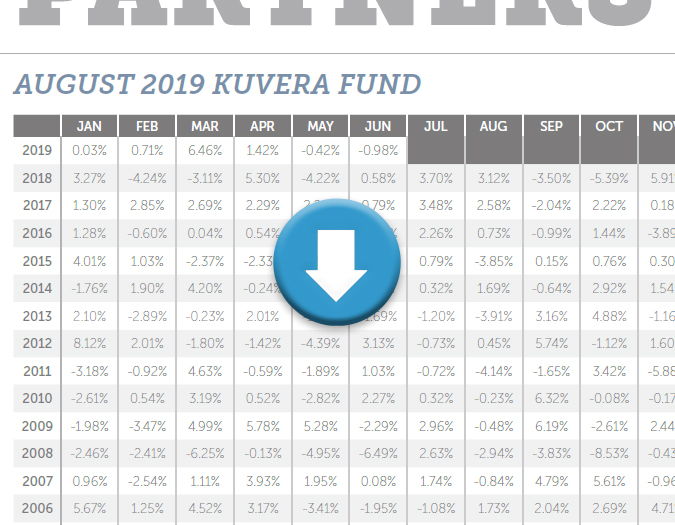
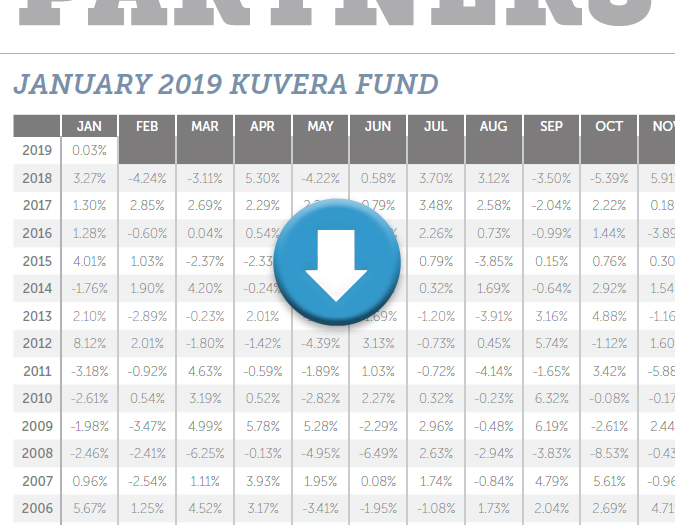
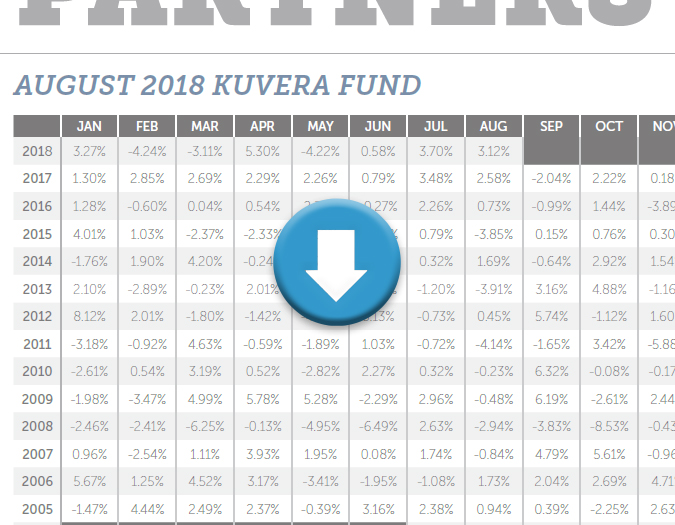
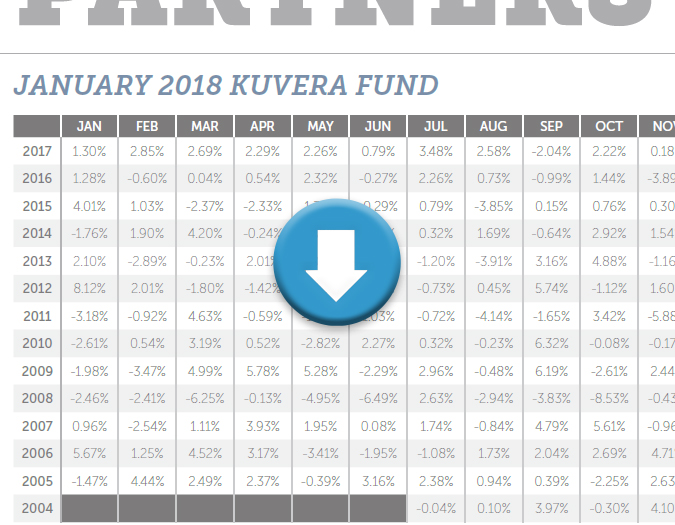
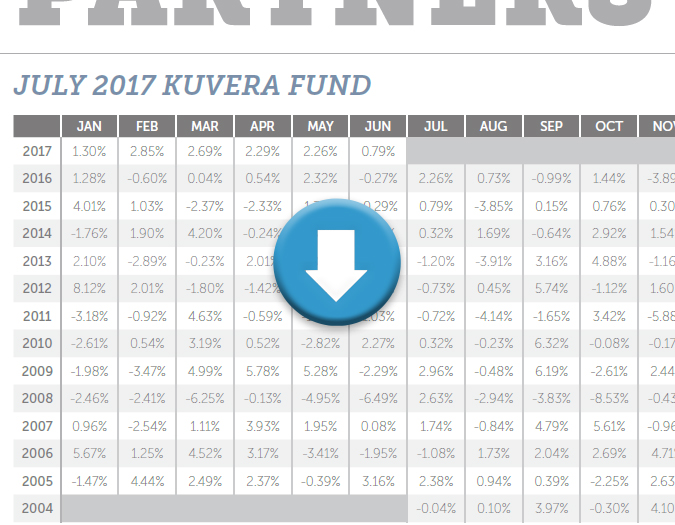
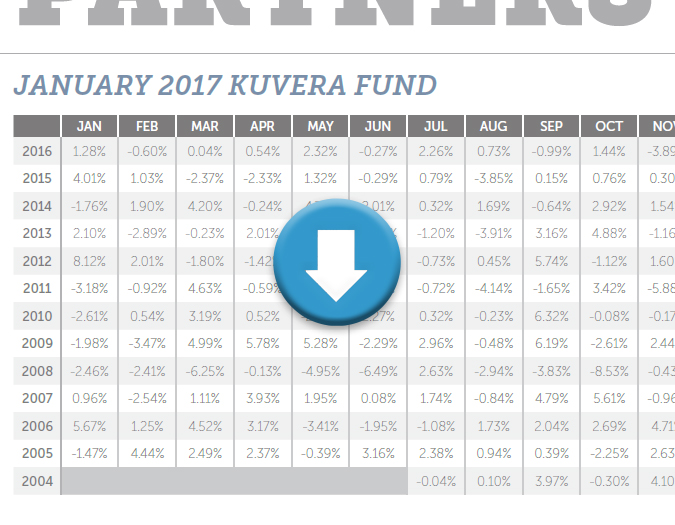
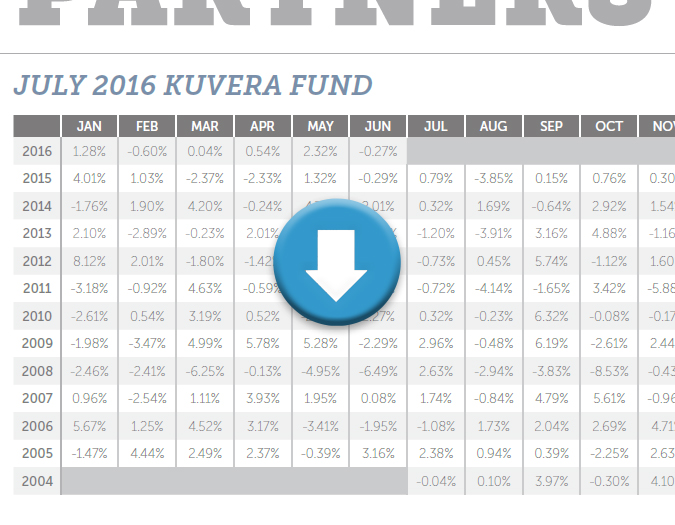
Monthly Returns (Since Inception)
Positive monthNegative month
YEAR
JAN
FEB
MAR
APR
MAY
JUN
JUL
AUG
SEP
OCT
NOV
DEC
YTD
2025
-3.60%
-9.23%
6.13%
2.93%
2.21%
3.99%
-3.54%
-0.64%
0.66%
2.43%
0.96%
0.11%
1.47%
2024
2.06%
4.24%
-0.65%
1.54%
8.27%
5.23%
6.68%
-0.45%
1.53%
-7.71%
-0.78%
-0.72%
19.85%
2023
-1.41%
-1.58%
-0.15%
3.04%
3.20%
5.44%
3.13%
0.65%
-2.45%
-2.30%
7.04%
7.20%
23.32%
2022
-3.56%
-4.62%
0.16%
-0.22%
-2.06%
-2.32%
5.78%
3.44%
-1.69%
2.86%
0.25%
-3.27%
-5.64%
2021
-2.42%
3.04%
2.49%
-0.07%
6.35%
1.58%
1.26%
7.28%
3.01%
-1.28%
-2.65%
2.58%
22.73%
2020
0.11%
-3.85%
23.97%
7.66%
-0.69%
2.72%
5.27%
2.11%
2.49%
3.20%
5.43%
7.96%
69.59%
2019
0.03%
0.71%
6.46%
1.42%
-0.42%
-0.98%
-2.88%
-0.88%
4.01%
2.93%
-1.70%
-0.05%
8.60%
2018
3.27%
-4.24%
-3.11%
5.30%
-4.22%
0.58%
3.70%
3.12%
-3.50%
-5.39%
5.91%
-0.49%
0.01%
2017
1.30%
2.85%
2.69%
2.29%
2.26%
0.79%
3.48%
2.58%
-2.04%
2.22%
0.18%
1.99%
22.51%
2016
1.28%
-0.60%
0.04%
0.54%
2.32%
-0.27%
2.26%
0.73%
-0.99%
1.44%
-3.89%
0.18%
2.91%
2015
4.01%
1.03%
-2.37%
-2.33%
1.32%
-0.29%
0.79%
-3.85%
0.15%
0.76%
0.30%
2.62%
1.89%
2014
-1.76%
1.90%
4.20%
-0.24%
4.71%
2.01%
0.32%
1.69%
-0.64%
2.92%
1.54%
-2.51%
14.79%
2013
2.10%
-2.89%
-0.23%
2.01%
-1.01%
-1.69%
-1.20%
-3.91%
3.16%
4.88%
-1.16%
1.19%
0.89%
2012
8.12%
2.01%
-1.80%
-1.42%
-4.39%
3.13%
-0.73%
0.45%
5.74%
-1.12%
1.60%
-0.23%
11.26%
2011
-3.18%
-0.92%
4.63%
-0.59%
-1.89%
1.03%
-0.72%
-4.14%
-1.65%
3.42%
-5.88%
-1.54%
-11.27%
2010
-2.61%
0.54%
3.19%
0.52%
-2.82%
2.27%
0.32%
-0.23%
6.32%
-0.08%
-0.17%
3.42%
10.81%
2009
-1.98%
-3.47%
4.99%
5.78%
5.28%
-2.29%
2.96%
-0.48%
6.19%
-2.61%
2.44%
0.65%
18.12%
2008
-2.46%
-2.41%
-6.25%
-0.13%
-4.95%
-6.49%
2.63%
-2.94%
-3.83%
-8.53%
-0.43%
10.58%
-23.56%
2007
0.96%
-2.54%
1.11%
3.93%
1.95%
0.08%
1.74%
-0.84%
4.79%
5.61%
-0.96%
2.19%
19.21%
2006
5.67%
1.25%
4.52%
3.17%
-3.41%
-1.95%
-1.08%
1.73%
2.04%
2.69%
4.71%
-1.33%
19.04%
2005
-1.47%
4.44%
2.49%
2.37%
-0.39%
3.16%
2.38%
0.94%
0.39%
-2.25%
2.63%
2.47%
18.32%
2004
-
-
-
-
-
-
-0.04%
0.10%
3.97%
-0.30%
4.10%
8.57%
17.22%
2025
YTD1.47%
Jan-3.60%
Feb-9.23%
Mar6.13%
Apr2.93%
May2.21%
Jun3.99%
Jul-3.54%
Aug-0.64%
Sep0.66%
Oct2.43%
Nov0.96%
Dec0.11%
2024
YTD19.85%
Jan2.06%
Feb4.24%
Mar-0.65%
Apr1.54%
May8.27%
Jun5.23%
Jul6.68%
Aug-0.45%
Sep1.53%
Oct-7.71%
Nov-0.78%
Dec-0.72%
2023
YTD23.32%
Jan-1.41%
Feb-1.58%
Mar-0.15%
Apr3.04%
May3.20%
Jun5.44%
Jul3.13%
Aug0.65%
Sep-2.45%
Oct-2.30%
Nov7.04%
Dec7.20%
2022
YTD-5.64%
Jan-3.56%
Feb-4.62%
Mar0.16%
Apr-0.22%
May-2.06%
Jun-2.32%
Jul5.78%
Aug3.44%
Sep-1.69%
Oct2.86%
Nov0.25%
Dec-3.27%
2021
YTD22.73%
Jan-2.42%
Feb3.04%
Mar2.49%
Apr-0.07%
May6.35%
Jun1.58%
Jul1.26%
Aug7.28%
Sep3.01%
Oct-1.28%
Nov-2.65%
Dec2.58%
2020
YTD69.59%
Jan0.11%
Feb-3.85%
Mar23.97%
Apr7.66%
May-0.69%
Jun2.72%
Jul5.27%
Aug2.11%
Sep2.49%
Oct3.20%
Nov5.43%
Dec7.96%
2019
YTD8.60%
Jan0.03%
Feb0.71%
Mar6.46%
Apr1.42%
May-0.42%
Jun-0.98%
Jul-2.88%
Aug-0.88%
Sep4.01%
Oct2.93%
Nov-1.70%
Dec-0.05%
2018
YTD0.01%
Jan3.27%
Feb-4.24%
Mar-3.11%
Apr5.30%
May-4.22%
Jun0.58%
Jul3.70%
Aug3.12%
Sep-3.50%
Oct-5.39%
Nov5.91%
Dec-0.49%
2017
YTD22.51%
Jan1.30%
Feb2.85%
Mar2.69%
Apr2.29%
May2.26%
Jun0.79%
Jul3.48%
Aug2.58%
Sep-2.04%
Oct2.22%
Nov0.18%
Dec1.99%
2016
YTD2.91%
Jan1.28%
Feb-0.60%
Mar0.04%
Apr0.54%
May2.32%
Jun-0.27%
Jul2.26%
Aug0.73%
Sep-0.99%
Oct1.44%
Nov-3.89%
Dec0.18%
2015
YTD1.89%
Jan4.01%
Feb1.03%
Mar-2.37%
Apr-2.33%
May1.32%
Jun-0.29%
Jul0.79%
Aug-3.85%
Sep0.15%
Oct0.76%
Nov0.30%
Dec2.62%
2014
YTD14.79%
Jan-1.76%
Feb1.90%
Mar4.20%
Apr-0.24%
May4.71%
Jun2.01%
Jul0.32%
Aug1.69%
Sep-0.64%
Oct2.92%
Nov1.54%
Dec-2.51%
2013
YTD0.89%
Jan2.10%
Feb-2.89%
Mar-0.23%
Apr2.01%
May-1.01%
Jun-1.69%
Jul-1.20%
Aug-3.91%
Sep3.16%
Oct4.88%
Nov-1.16%
Dec1.19%
2012
YTD11.26%
Jan8.12%
Feb2.01%
Mar-1.80%
Apr-1.42%
May-4.39%
Jun3.13%
Jul-0.73%
Aug0.45%
Sep5.74%
Oct-1.12%
Nov1.60%
Dec-0.23%
2011
YTD-11.27%
Jan-3.18%
Feb-0.92%
Mar4.63%
Apr-0.59%
May-1.89%
Jun1.03%
Jul-0.72%
Aug-4.14%
Sep-1.65%
Oct3.42%
Nov-5.88%
Dec-1.54%
2010
YTD10.81%
Jan-2.61%
Feb0.54%
Mar3.19%
Apr0.52%
May-2.82%
Jun2.27%
Jul0.32%
Aug-0.23%
Sep6.32%
Oct-0.08%
Nov-0.17%
Dec3.42%
2009
YTD18.12%
Jan-1.98%
Feb-3.47%
Mar4.99%
Apr5.78%
May5.28%
Jun-2.29%
Jul2.96%
Aug-0.48%
Sep6.19%
Oct-2.61%
Nov2.44%
Dec0.65%
2008
YTD-23.56%
Jan-2.46%
Feb-2.41%
Mar-6.25%
Apr-0.13%
May-4.95%
Jun-6.49%
Jul2.63%
Aug-2.94%
Sep-3.83%
Oct-8.53%
Nov-0.43%
Dec10.58%
2007
YTD19.21%
Jan0.96%
Feb-2.54%
Mar1.11%
Apr3.93%
May1.95%
Jun0.08%
Jul1.74%
Aug-0.84%
Sep4.79%
Oct5.61%
Nov-0.96%
Dec2.19%
2006
YTD19.04%
Jan5.67%
Feb1.25%
Mar4.52%
Apr3.17%
May-3.41%
Jun-1.95%
Jul-1.08%
Aug1.73%
Sep2.04%
Oct2.69%
Nov4.71%
Dec-1.33%
2005
YTD18.32%
Jan-1.47%
Feb4.44%
Mar2.49%
Apr2.37%
May-0.39%
Jun3.16%
Jul2.38%
Aug0.94%
Sep0.39%
Oct-2.25%
Nov2.63%
Dec2.47%
2004
YTD17.22%
Jan-
Feb-
Mar-
Apr-
May-
Jun-
Jul-0.04%
Aug0.10%
Sep3.97%
Oct-0.30%
Nov4.10%
Dec8.57%
Statistics
Kuvera risk-return statistics
⚠ Past performance is not a reliable indicator of future results. Statistics are calculated since inception and based on historical data; they do not guarantee future performance.
0
year history
of the index volatility
Annualised return as a percentage of Nifty ($) Index return
Compound Annual Return
Standard Deviation
0
Sharpe Ratio
Rolling 5Y (annual return)
Rolling 3Y (annual return)
Rolling 1Y (annual return)
Max Drawdown (2008)
Winning Ratio
Investment Awards
The maximum drawdown figure represents the largest peak-to-trough decline experienced by the fund and is a key indicator of downside risk. The winning ratio refers to the proportion of months in which the fund generated a positive return; it does not indicate the magnitude of gains or losses.
Newsletters
Download Kuvera newsletters
pdf
H2 2024
pdf
H1 2024
pdf
2021
pdf
2020
pdf
H2 2019
pdf
H1 2019
pdf
H2 2018
pdf
H1 2018
pdf
H2 2017
pdf
H1 2017
pdf
H2 2016
pdf
H1 2016
Approach
Our approach enables clients to remain invested in the India growth story for the long term
Portfolio Construction
Portfolios are constructed to extract the desired risk return profile with limits on position size, sector and exposures.
Macro View
An understanding of global risks as they affect India.
Detailed Market Knowledge
Large cap focus: a detailed knowledge of companies in our universe.
Short Book Strategy
An active short book made up of stocks not an Index.
Risk Management and Derivatives
Derivatives are used to hedge out residual portfolio risk.
India
The Growth Story
A summary of key trends that typifies the Indian market
Market data and statistics referenced in this section are sourced from third parties and may not reflect current conditions. They are included for illustrative purposes only and should not be relied upon as current investment research. Last updated: June 2026.
Kuvera believes India has the potential to be one of the world's fastest-growing major economies over the coming decades. This reflects Kuvera's own view, is not a forecast or guarantee of any specific growth rate, and actual outcomes may differ materially.
Kuvera views India's large and relatively young population as a structural driver of long-term economic growth.
Kuvera sees continued growth potential in India's manufacturing sector, supported by rising education and engineering skill levels.
Kuvera anticipates sustained growth in India's consumer market as the middle class continues to expand.
India's GDP growth rate has consistently ranked among the highest of major economies in recent years. [Source: IMF World Economic Outlook & World Bank · Updated June 2026]
India's government has pursued a sustained programme of economic reform and infrastructure investment. [Source: IMF World Economic Outlook & World Bank, 2024–2026]
The Indian automobile industry is one of the largest in the world by annual production. [Source: [SIAM], [2025]]
The Indian retail market is one of the largest and fastest-growing in the world. [Source: [KPMG Retail Sector Snapshot], [2026]]
India's consumer market is projected to become one of the world's largest in the coming decades. [Source: [IBEF], [2025]]
India is one of the largest economies in the world by both nominal GDP and purchasing power parity (PPP). [Source: [IMF], [2026]]
India is home to a large and growing number of billionaires. [Source: Forbes, [2025]]
“…in PPP terms, the Indian economy is projected to overtake the US and Chinese economies in 2045 and 2063, respectively.” Source: EY (Ernst & Young), 2025
This is a third-party projection and does not constitute investment advice or a guarantee of returns.
The Opportunities & Challenges
Kuvera has a positive view but acknowledges the risks in getting there
Progressive
Kuvera believes India's current government remains focused on reducing bureaucracy, devolving power, and attracting capital. This reflects Kuvera's own view of government policy and is not a guarantee of any particular outcome.
Because...
Needs Foreign Investment
Kuvera believes India is supply-constrained and needs to attract continued foreign capital to achieve its growth potential. This reflects Kuvera's own view and is not a statement of fact or a guarantee of any outcome.
Therefore...
Globally In Sync
Growth and equity markets linked to global factors and liquidity.
Challenge #1
Poverty
Kuvera recognises that addressing poverty remains a significant long-term challenge for India's economy and policymakers.
Challenge #2
Red Tape
Kuvera believes that, despite ongoing reform efforts, bureaucratic complexity remains a challenge for businesses operating in India.
Challenge #3
GDP
Kuvera notes that India's GDP per capita remains relatively low compared with developed economies, which Indian government policy has sought to address.
Team
The leadership team of Kuvera
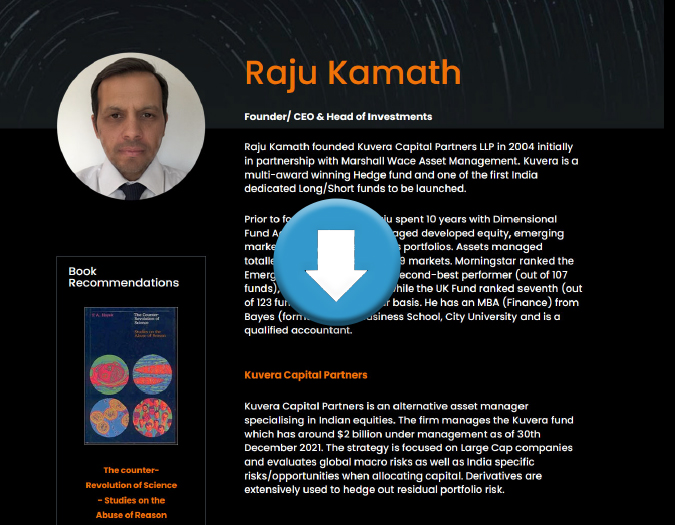
Raju Kamath
Founder, CEO & Head of Investments
Prior to founding Kuvera, Raju spent 10 years with Dimensional Fund Advisors, where he developed and managed emerging markets equity and derivatives portfolios.
Assets managed totalled $1bn, invested across 19 markets. Prior to founding Kuvera, his Emerging Market Fund at Dimensional was ranked 2nd best performer by Morningstar (out of 107 funds, on a 5-year basis) and 3rd best (out of 173 funds, on a 1-year basis), as at 31 March 2003.
The UK Fund was ranked 7th (out of 123 funds) on a 3-year basis and 10th (out of 69 funds) on a 1-year basis, at the same date. These rankings relate to a prior role and are not indicative of the current or future performance of the Kuvera Fund. He has an MBA (Finance) from Cass Business School, City University.
Wilson Hudkins Cáceres
COO
Wilson is the Chief Operating Officer of the Kuvera Fund. He is responsible for overseeing multiple business functions and assists in the development of the firm's long-range business plan.
Previously, he was a Partner at Sigrun Partners as well as Managing Director at Fortis Bank (Now BNP PARIBAS FORTIS). Wilson has held senior positions at Abn Amro Bank, ACF Corporacion and other international and regional financial institutions.
He is a Chartered Financial Analyst (CFA) as well as a Professional Risk Manager (PRM). He holds an MBA as well as a BBA.
Rohit Shah
CFO
Previously Rohit was with BP Oil Trading for 15 years in London and South Africa.
His responsibilities included the automation and improvement of both back and front office processes as well as development of risk management systems for European Oil Trading. He subsequently founded an IT business.
At Kuvera, Rohit is responsible for improving the efficiency of operational controls and automation of both back and front office processes. He is an IT specialist and a qualified accountant.
Awards
Historic industry awards and nominations
The awards and nominations shown above relate to specific past periods. Details of each award, including the awarding body and year, are available on request. Past awards and nominations are not indicative of current or future performance and do not constitute an endorsement of any current product or strategy.
Media
Fund Information
Download more information about Kuvera Capital Partners LLP
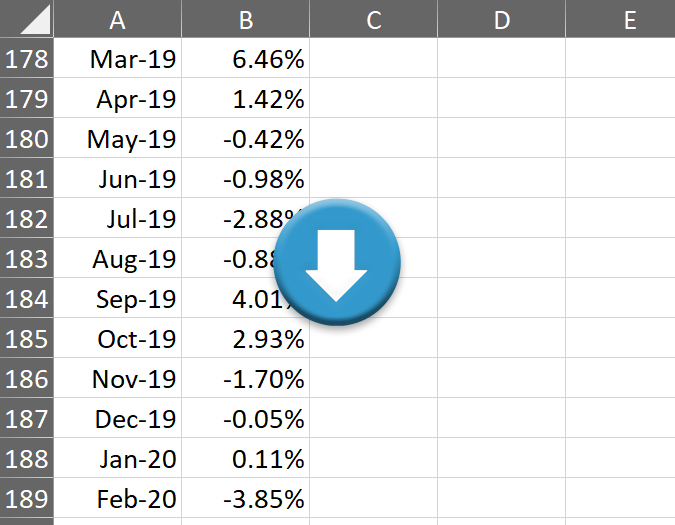
The fund information documents and monthly returns file linked below are directed exclusively at Professional Clients and Eligible Counterparties as defined in the FCA Handbook and are not intended for Retail Clients. They are provided for information only and do not constitute investment, legal, tax or other professional advice, nor an offer or solicitation to buy or sell any investment. Past performance is not a reliable indicator of future results. The value of investments and any income from them may fall as well as rise and investors may not recover the amount originally invested.
pdf
Fund Brochure
pdf
Monthly Factsheet
xls
Monthly Returns
Articles
Download published articles about Kuvera
The articles and third-party publications linked below are historic materials provided for background information only. They reflect the views of their respective authors and publications at the time of writing, do not constitute a current or ongoing endorsement of Kuvera Capital Partners LLP or the Kuvera Fund, and are not indicative of current or future performance.
pdf
SEVVA COP26
Interview with Raju Kamath
pdf
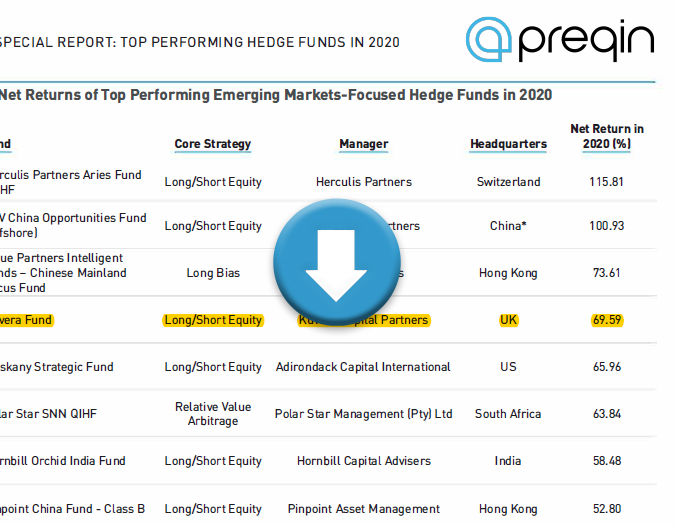
PREQIN REPORT
Top Performer Nomination
pdf
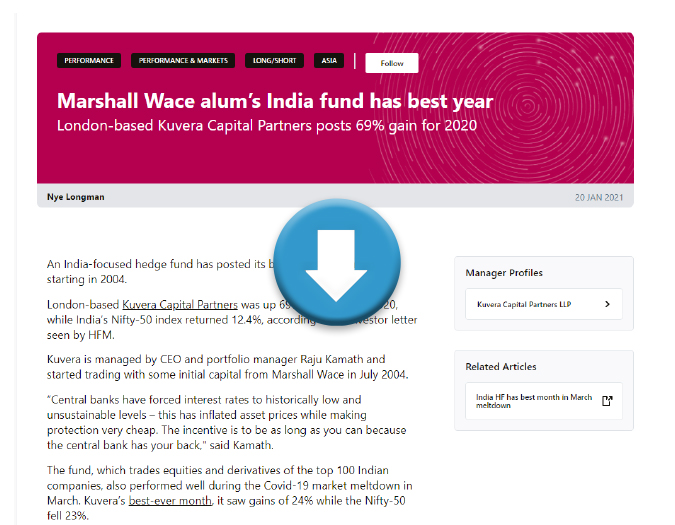
EUROHEDGE
Marshall Wace alum’s India fund has best year
pdf
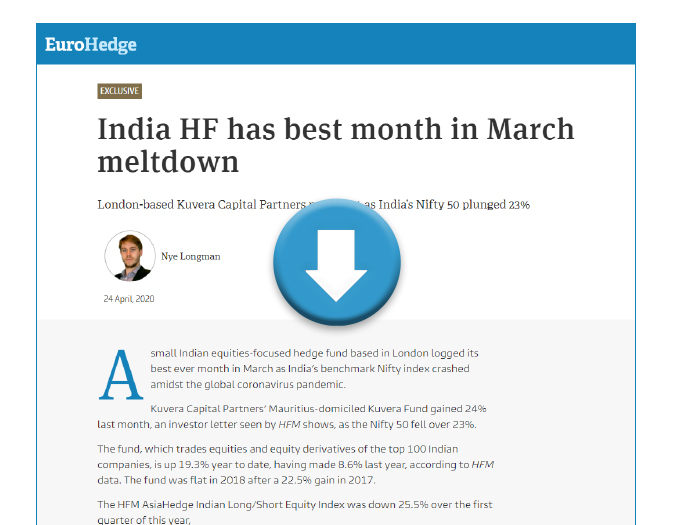
EUROHEDGE
India HF has best month in March meltdown
pdf
ISFMAGAZINE
International Securities finance India HF
pdf
THE HINDU
It is important to communicate to the world what India is trying to achieve
pdf
BLOOMBERG
India focused HF perform best globally on "Modi, the Hero"
pdf
GULF NEWS
Kuvera gets green light to operate from DIFC
pdf
ARABIAN BUSINESS
Indian fund sets sights on GCC
pdf
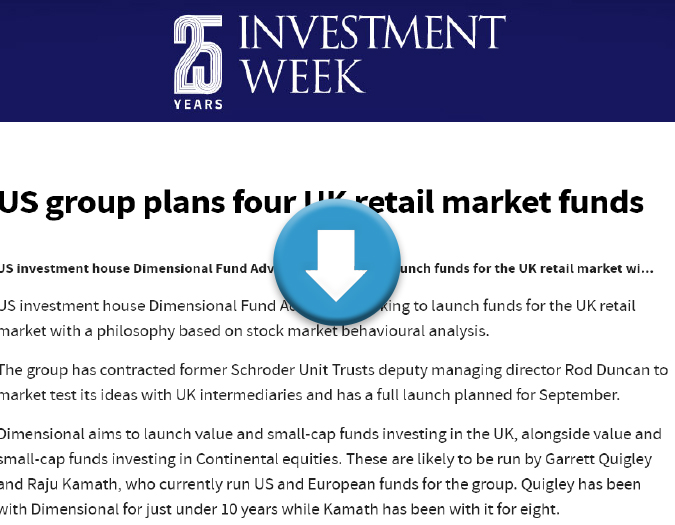
INVESTMENT WEEK
US group plans four UK retail market funds
The articles, interviews and nominations shown above relate to specific historic periods and reflect the views of their respective authors and publications at the time of writing. They do not constitute a current or ongoing endorsement of Kuvera Capital Partners LLP or the Kuvera Fund, and are not indicative of current or future performance.
Videos
Watch videos about Kuvera
Videos were recorded at various points in time and may contain views, opinions and market commentary that are no longer current. They are provided for information only and are not indicative of current or future performance.
Bloomberg TV
Invest In India
Bloomberg TV
Hedge Fund Corner
Edelweiss Webinar
Kuvera Capital - Introduction
Edelweiss Webinar
Is now a good time to be establishing a hedge fund?
Edelweiss Webinar
What are the initial considerations for setting up a hedge fund?
Edelweiss Webinar
How do you make yourself visible to allocators?
Edelweiss Webinar
Given the performance for 2020, what are the expectations for future performance?
HFM Asia 2022
How must the hedge fund industry revolutionise to reach its potential?
Please read carefully the following Terms and Conditions & Privacy Policy.
Kuvera Capital Partners LLP has issued the information contained within this website solely to investors who are Eligible Counterparties or Professional Clients within the respective meanings of those terms under COBS Chapter 3 of the FCA Handbook.
Nothing on this website constitutes investment, legal, tax or other professional advice. Prospective investors should obtain independent professional advice before making any investment decision.
The legal and regulatory restrictions in relation to the Kuvera Capital Partners LLP website are set out below. By entering the Kuvera Capital Partners LLP website you will be deemed to have accepted the conditions below (the "Conditions") and as such this page constitutes a binding legal agreement.
By accessing any page of this website, you agree to be bound by the Conditions. If you do not agree to the Conditions, please exit the website. This page is designed to exclude ineligible categories of investors from entering the website. Kuvera Capital Partners LLP will not be responsible for any misrepresentations you may make in gaining unauthorised access.
The Conditions may be amended without notice to you. By continuing to use the website following any such changes you will be deemed to have accepted such changes.
Limited regulatory protection
KUVERA CAPITAL PARTNERS LLP is a trading name of Kuvera Capital Partners LLP which is authorised and regulated by the Financial Conduct Authority in the United Kingdom. Investments described on this website may not benefit from certain protections available to investors in UK-authorised retail investment products, including access to the Financial Ombudsman Service or the Financial Services Compensation Scheme in certain circumstances. Prospective investors should review the relevant offering documents carefully and seek independent professional advice where appropriate before making any investment decision.
Limitation of liability
To the maximum extent permitted by applicable law and FCA regulations, Kuvera Capital Partners LLP excludes liability for errors or omissions in the content of this website, including without limitation any liability arising from loss of profit or any other direct or consequential damage. Nothing in these terms excludes liability for fraud, fraudulent misrepresentation, death or personal injury caused by negligence, or any other liability that cannot be excluded under applicable law or FCA rules. Any opinions or estimates included herein constitute a judgement as at the date of publication and are subject to change without notice.
Risk factors
Investment in the funds referred to in this website involves significant risks. These funds are intended solely for Professional Clients and Eligible Counterparties as defined under COBS 3 of the FCA Handbook, who understand and can accept the risks of substantial or complete loss of their investment.
The value of investments and any income derived from them can go down as well as up and the value of an investor's investment may be subject to sudden and substantial falls. The loss on realisation may be very high and could result in a substantial or complete loss of its investment.
Investments described on this website may not benefit from certain protections available to investors in UK-authorised retail investment products, including access to the Financial Ombudsman Service or the Financial Services Compensation Scheme in certain circumstances. Prospective investors should review the relevant offering documents carefully and seek independent professional advice where appropriate before making any investment decision. Investors should be fully aware of the restrictions on transfer of investments.
The prices of commodities contracts and all derivatives instruments, including futures and options, are highly volatile. Certain investment positions may be illiquid. The funds referred to in this website may invest in securities of financially troubled companies, illiquid over-the-counter securities and non-publicly traded securities.
Investment in emerging market funds involves risk factors and special considerations which may not be typically associated with investing in more developed markets. Political or economic change and instability may be more likely to occur and have a greater affect on the economies and markets of emerging countries. Adverse government policies, taxation, restrictions on foreign investment and on currency convertibility and repatriation, currency fluctuations and other developments in the laws and regulations of emerging countries in which investment may be made, including expropriation, nationalisation or other confiscation could result in loss to the fund.
The risk factors referred to above are not an exhaustive list and reference should be made to the relevant Prospectus.
No offer or solicitation
Nothing on this website constitutes an offer or solicitation to buy or sell any investment or financial instrument. Information is provided for informational purposes only and may not be relied upon in any jurisdiction where such communications would be unlawful.
This website does not constitute and should not be used for the purpose of an offer or solicitation in any jurisdiction or in any circumstances in which such offer or solicitation is unlawful or not authorised. Persons resident in territories other than the UK should consult their professional financial advisers as to whether they require any governmental or other consents or need to observe any formalities to enable them to invest in any product described in this website.
U.S. Persons
The provision of the information in this website does not constitute an offer to purchase securities to any person in the United States or to any U.S. Person as such term is defined under the Securities Act of 1933, as amended. The information contained in this site about Kuvera Capital Partners LLP and/or any of its affiliates is not directed to any person in the United States.
Advice
No information contained within this website should be construed as investment advice.
Taxation
Taxation will depend on individual financial circumstances and the country of residence.
Ownership and copyright
The copyright in this website and (unless otherwise indicated) its contents including all information, graphics, code, text and design are owned by Kuvera Capital Partners LLP and should not be reproduced or distributed without permission.
Cookies
This website uses cookies for the purpose of enhancing the user's browsing experience. The cookies we use are purely functional and do not collect any personal information.
Most web browsers provide settings which enable a user to control cookies. To find out more about cookies and how to manage or delete them, visit ico.org.uk.
You confirm by proceeding that you are not a private investor or subject to any jurisdictional restrictions permitting access to information on any product described on this website.
Restricted Access
Access to fund related documents not publicly available.
You will be able to use a password to access specific documentation. Please note that this feature is currently under development.
We use cookies to ensure you get the best experience on our website. In line with the Privacy and Electronic Communications Regulations (PECR), we need to ask for your consent to set the cookies. Learn more